Route Suggestion with Real-Time Kafka-topic Streamed Data
Project of big data to use real time simulated (SUMO) traffic data streamed by rotating Kafka topics. The objective was to assist the emergency respondent team to reach their destination in a more efficient way, by taking the current traffic status into consideration. A fictive city, closely related to the real city and infrastructure of Copenhagen, in xml format was used as the city’s infrastructure.

The data was streamed as a simulation of real-life city traffic to three kafka topics at specific times throughout the day to a Hadoop distributed file system (HDFS). In order to produce views for successfully suggesting optimal route, we set up three tasks that will be based on the simulated data:
1. Identify vehicle movement across the city and update statistics for each lane and intersection it passes through
2. Identify traffic jams based on vehicle short historic data by calculating ratio of street capacity versus flow of traffic
3. Apply A* algorithm that uses the statistics for each node and edge in a directed graph to suggest optimal route
With the HDFS we stored and processed the information by parsing the traffic data through a Python script which identified each vehicle and its movement. It was done so by comparing each object with a master data-set which stored historical information for each vehicle that either updated its history or created a new entry. Once driving the vehicles driving session was ended and no longer used, the data was discarded due to the objective of providing real-time suggestions.
We designed the system to have the following two components:
– Vehicle short historic data
– City map as directed graph with dynamic statistics
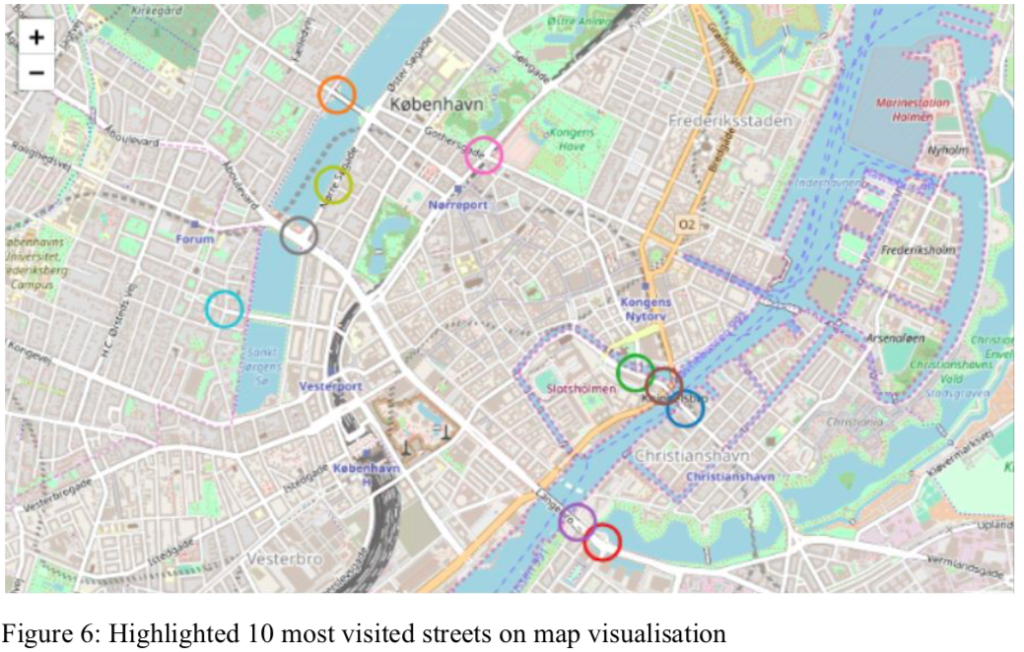
By tracking the vehicle movement across the city, we gained statistics of the traffic activity in the streets of the city. Below, a map is presented with the most visited streets highlighted.

These are obviously also the streets with the highest capacity, so it did not provide any particular useful at this stage. However, by using these counts in the calculation of ratio between capacity and flow, we were able to tell more about the “level of congestion”. This was done by categorising the streets by their actual capacity. The official categorisation by the municipality of Copenhagen was used:

Below, I present the calculated level of congestion from the 10 most visited streets highlighted in the map above. They are ranked from the left to right in terms of car count, which now shows that Dronning Louises Bro is the most congested.

By using this information when applying the A* star algorithm, the suggested route was no longer the shortest in terms of kilometers, but a combination of distance and congestion. The result can be seen in the plots below:
